Print History & Telemetry
Key Concepts
Print history is the permanent record of what your printers actually did. Every time a printer runs one of your jobs, Printago records the temperatures it held, the layers it completed, the events the printer reported, the filament it really spent, and (when enabled) a timelapse and completion photo. That record lives on the job, so you can look back at exactly how a print went long after it finished, instead of relying on the slicer's prediction of how it should have gone.
The unit of history is the attempt, not the job. Retrying a job never overwrites what came before: a job printed three times keeps three separate records, each with its own telemetry, media, material usage, and outcome. That is what lets you put a run that failed next to the one that finished and see what changed.
Telemetry is the measured half of an attempt: a temperature and progress trace sampled across the whole print, paired with an event log of the discrete things the printer reported, such as state changes, pauses, filament changes, skipped objects, and errors with their codes. Together they let you place a failure at a moment in time rather than guessing at it, and they are the measurements behind the filament totals shown for the attempt, which is why a failed print is charged only for what it spent before it stopped.
Opening a job's history
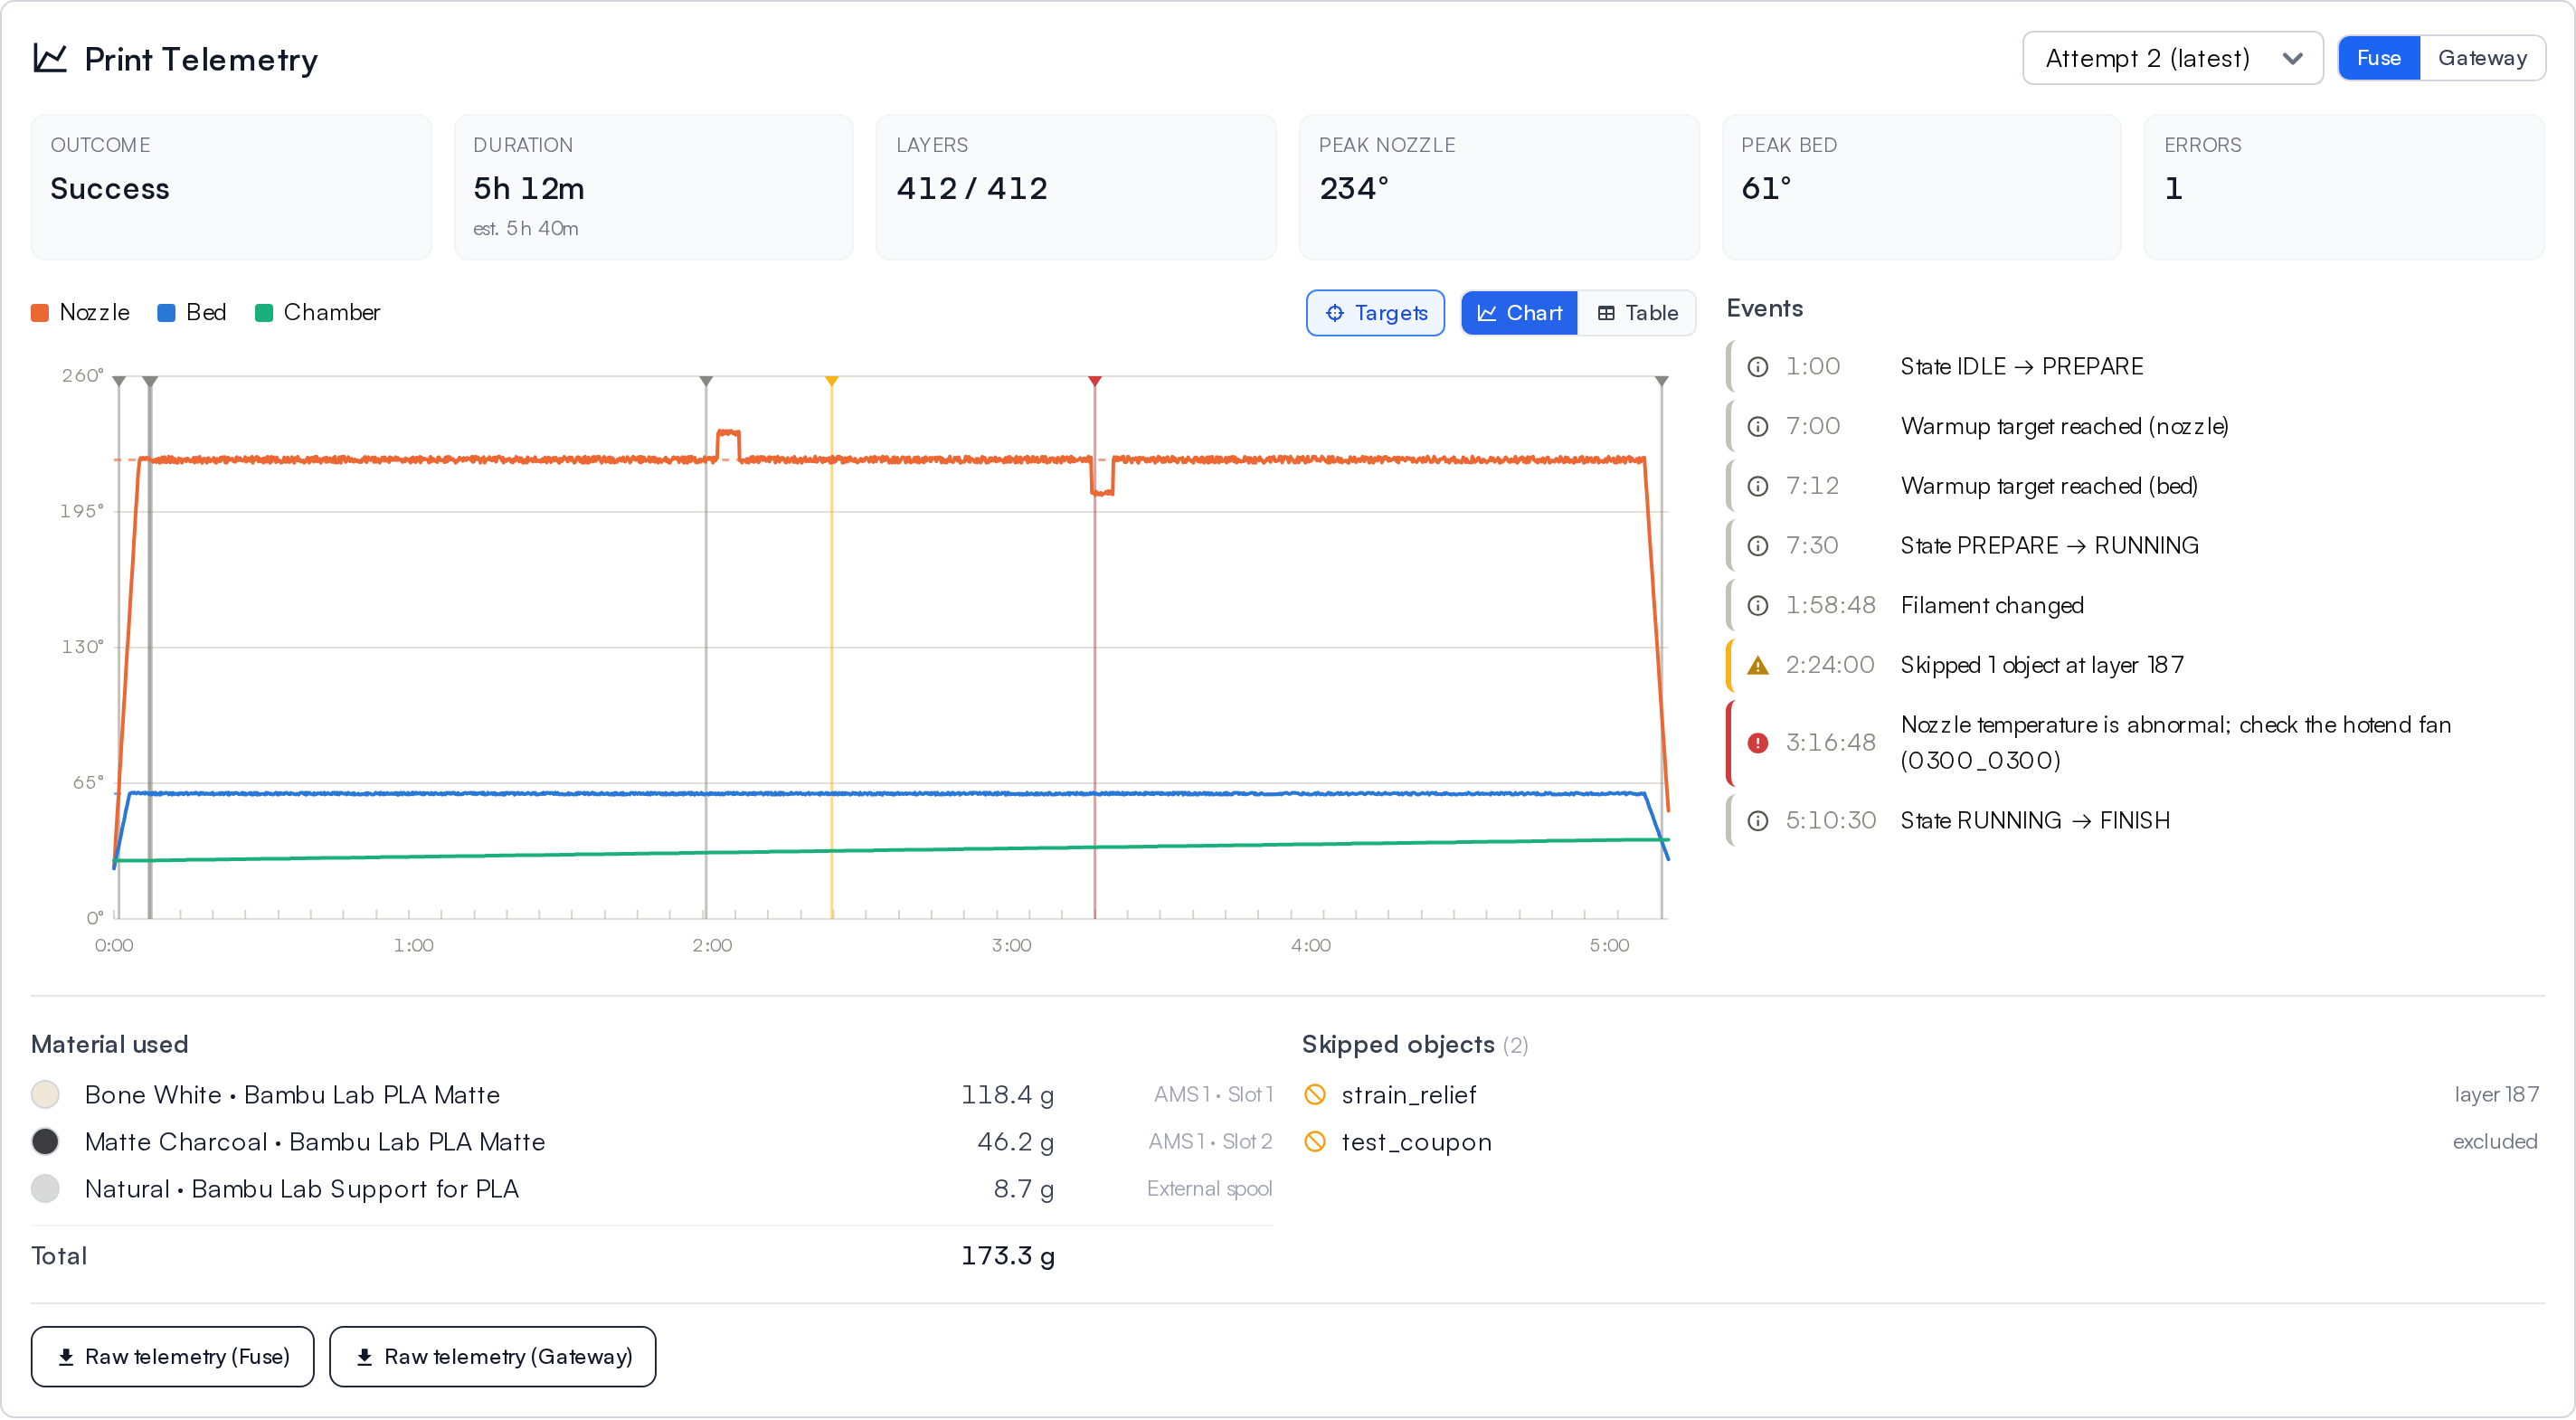
From the Print Queue, click any job to open its detail page. Finished jobs show a Print Telemetry panel with an at-a-glance summary of the print, a temperature graph, and an event log.
The temperature graph
The graph plots the whole print on one timeline:
- Nozzle, bed, and chamber temperatures, each with a solid line for the actual reading and a dashed line for the target. Use the legend to show or hide any of them, and Targets to hide the dashed target lines. A component with no setpoint (an unheated chamber, or a heater switched off at the end of the print) has no target line rather than one drawn at zero.
- Layer changes appear as light ticks along the bottom, so you can see the print's pace.
- Events (state changes, warnings, errors) appear as colored flags on the timeline.
- Hover anywhere on the graph to read the exact temperatures, layer, and progress at that moment.
- When the print has a timelapse, switch on Timelapse above the graph and the hover readout also shows the timelapse frame captured closest to that moment, so you can scrub along the graph and watch the print take shape beside its temperatures. It starts off so the page does not load the video unless you want it. Frames are captured every few minutes rather than continuously, so the picture is the nearest one to where you are pointing, not an exact match.
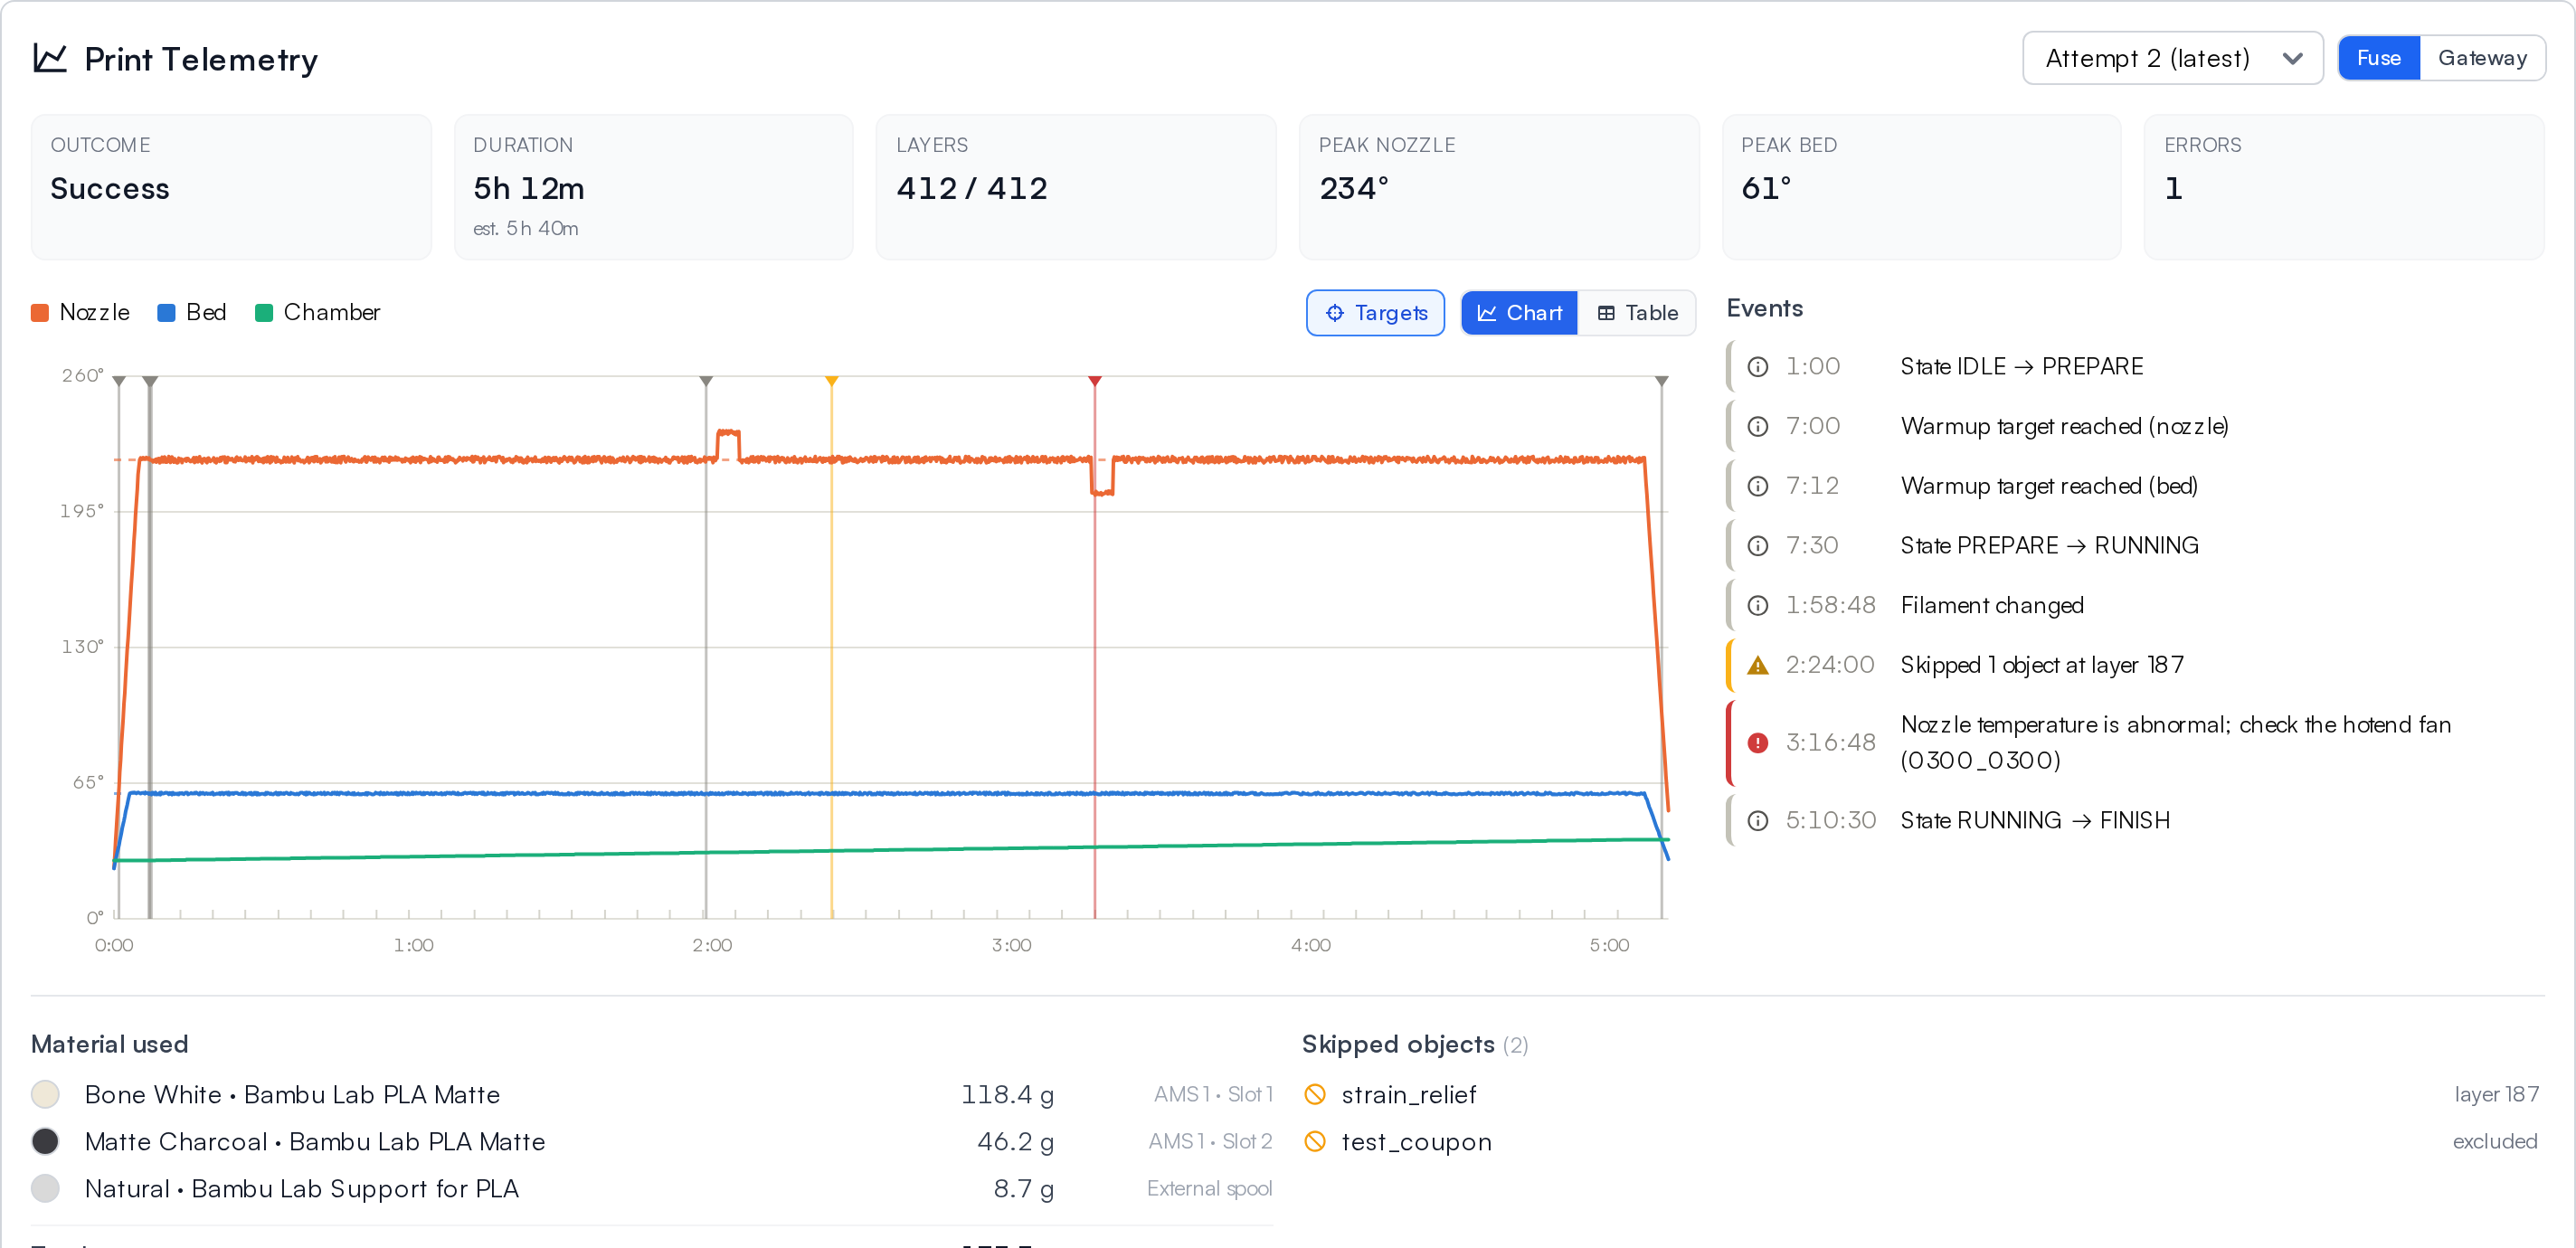
Two recordings can feed the graph. Printers connected through Printago Fuse upload a high-detail flight recording, and Printago's gateway keeps a lighter sampled series for every print. When both exist, a Fuse / Gateway toggle lets you switch between them; otherwise the best available one is shown automatically.
Reading the numbers instead
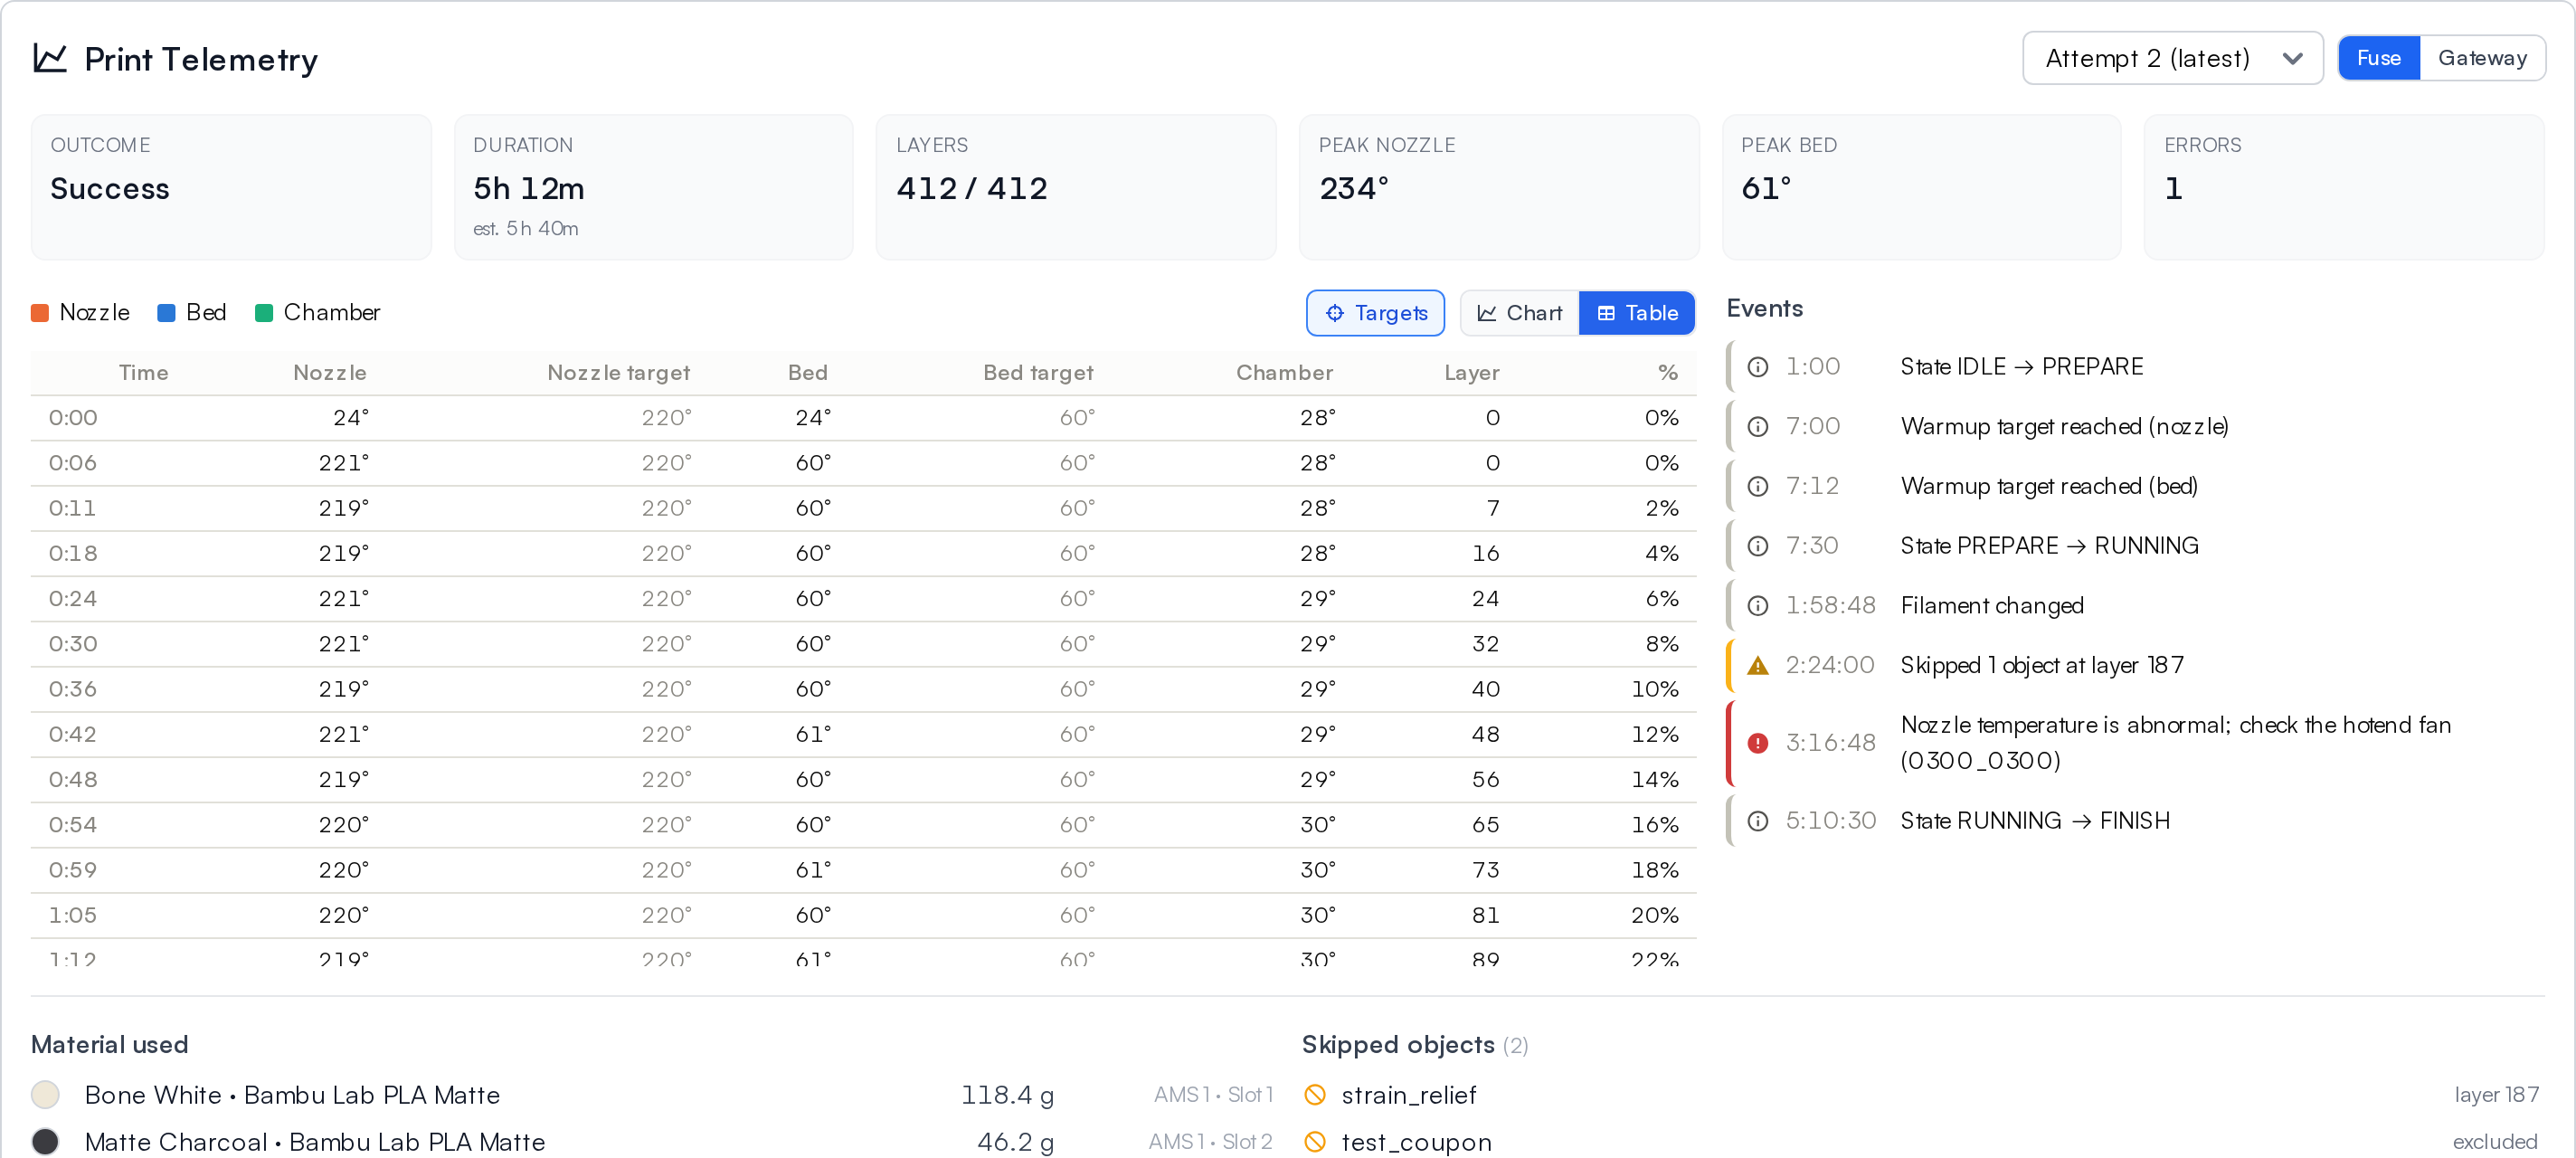
Switch Chart to Table for the same readings as text: a row per sample with the temperatures, the target beside each one, and the layer and progress reached. It is the better view when you want exact values or are reading the page with a screen reader, and it follows the legend and Targets just like the chart does.
The event log
The Events list beside the graph is a timeline of everything the printer reported during the print: state changes (including pauses and resumes), filament changes, skipped objects, and any errors with their codes. Hover an event to highlight where it happened on the graph.
Material used and skipped objects
Below the graph, Printago breaks down the print's outcome in detail:
- Material used: filament actually consumed per color, with the material name and type, the exact grams used, and which slot it came from (AMS slot or external spool), plus the total. This reflects what the print really used, so a failed or cancelled print shows only the filament spent before it stopped, not the full-print estimate.
- Skipped objects: any objects that were excluded from the print, either up front or skipped mid-print, with the layer they were skipped at. Mid-print skips are also flagged on the graph and in the event log. This is recorded per attempt, so a retried job shows what each attempt actually skipped, which is also what its filament total was measured against.
For the full accounting rules behind these numbers (how partial prints are prorated, how skipped objects are deducted, and what the record keeps alongside the slicer's estimate), see Material Usage Tracking.

Retried prints
If a job was printed more than once, each attempt keeps its own telemetry, timelapse, photo, and logs. The panel opens on the latest attempt; use the attempt dropdown to replay an earlier one. Everything below the selector updates to the attempt you pick.
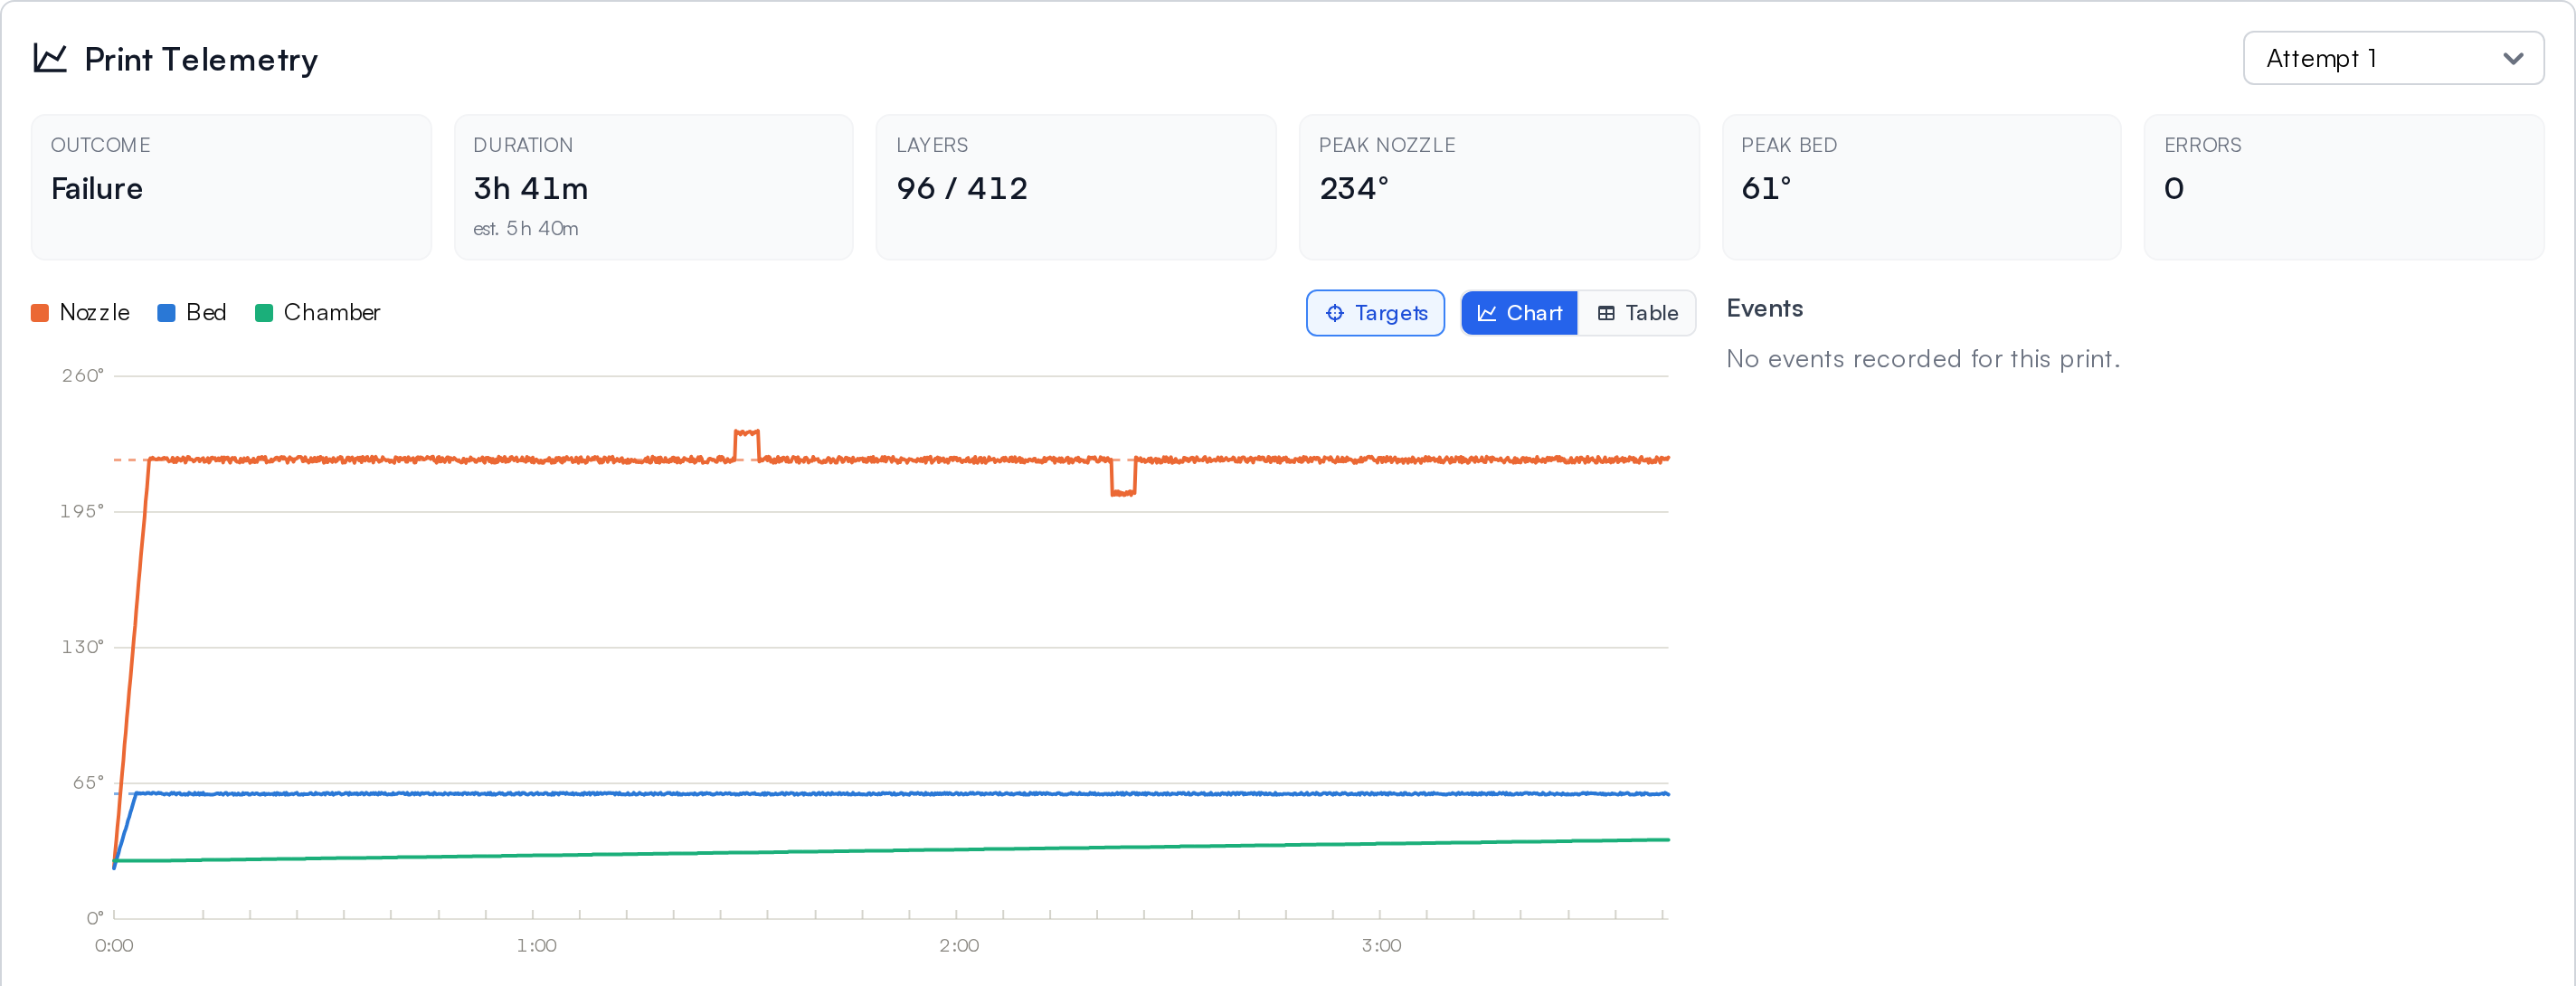
The graph only fills in once a print ends, so until then it tells you where the print is instead: a queued job reads This print hasn't started yet, and one on the printer reads This print is in progress.
Downloads
From the same panel you can download that attempt's timelapse, completion photo, and the raw telemetry recording for your own analysis.
Downloading the raw telemetry requires the file download permission, and the timelapse and completion photo require the camera permission. Anyone who can view the queue can see the graph, events, and material usage.
Turning telemetry on or off
Temperature and event telemetry is on by default. You can opt out under Settings > Account > General. Timelapses and completion photos follow their own camera settings.
Looking across many prints
The telemetry above covers a single job. Reporting across your whole print history (filtering, totals, and trends over many jobs) is currently available through the Printago API, at the print-history endpoints, rather than in the app. A dedicated in-app history browser is on the way. See the developer docs for the API.