Reports
Key Concepts
Reports is your farm's analytics hub. It answers the questions you would otherwise pull from spreadsheets: how many prints ran this month, how often they succeeded, what failures cost you in filament and machine time, which printers earn their keep, what materials you burn through, and what your margins look like. Open it from the Reports item in the sidebar.
Reports is organized as a hub with five subject areas, and a sixth, Usage by user, with the Filament Inventory add-on. The hub page shows the headline numbers for each area at a glance, and every preview card links to a full report page with charts and a detail table. Each report page is a real URL, so you can bookmark the view you check every morning.
The Hub
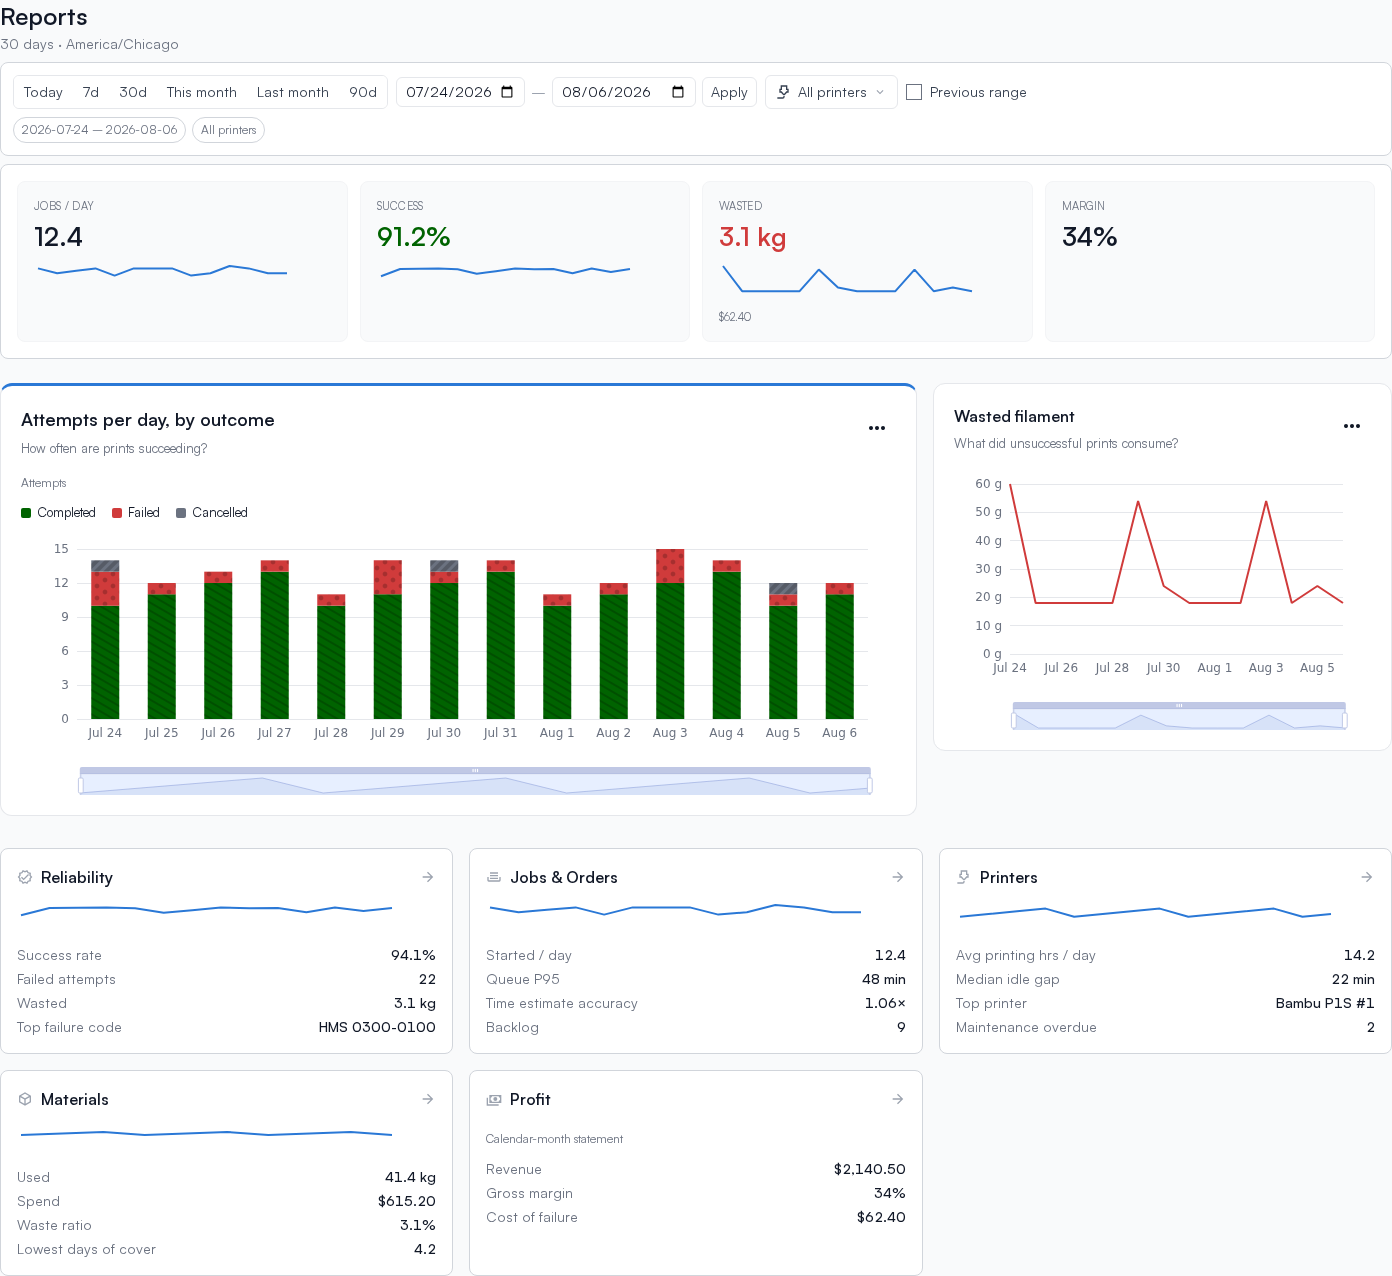
The hub leads with a KPI strip for the selected date range: jobs per day, success rate, wasted filament (with its estimated cost when your material prices are set), and gross margin. A large prints-by-outcome chart and a waste trend show where to look first. A preview card for each area shows key numbers and daily trends where those series are available:
- Reliability: success rate, failed prints, wasted filament, and your most common failure code.
- Jobs & Orders: daily throughput, queue wait times, estimate accuracy, and current backlog.
- Printers: average printing hours per day, idle gaps, your top printer, and overdue maintenance.
- Materials: filament used, spend, waste ratio, and the spool closest to running out.
- Profit: revenue, gross margin, and the cost of failed prints.
- Usage by user: what to bill, filament used, how many people printed, and unattributed filament. Shown with the Filament Inventory add-on.
The date range you pick (today, 7 days, 30 days, this month, last month, 90 days, or a custom range) and any printer filter follow you from report to report, so switching pages keeps your context. All daily numbers are grouped by your store's timezone, which you can set in Settings, on the General tab under Organization details.
Reliability
The reliability report is where most farms start. It shows prints per day broken down by outcome (completed, failed, cancelled) with a success rate trend, plus:
- Wasted filament and machine hours: the weight and hours spent on failed and cancelled prints, charted by day. This is the number that converts directly to money.
- First-print yield: how many jobs finished on the first try versus needing a retry. Retries are easy to miss because the job eventually completes, but you still paid for the failed print.
- Failure Pareto: your most common printer error codes, ranked. Fixing the top one or two usually removes most of the pain.
- Layer of failure: a histogram of how far failed prints got. Failures clustered near the start usually point to bed adhesion; failures near the end point to filament runout or spaghetti detection. The fixes are completely different, which is why the chart shows the distribution instead of an average.
- MTBF by printer: mean printing hours between failures for each physical machine. One bad unit often hides inside a healthy fleet average.
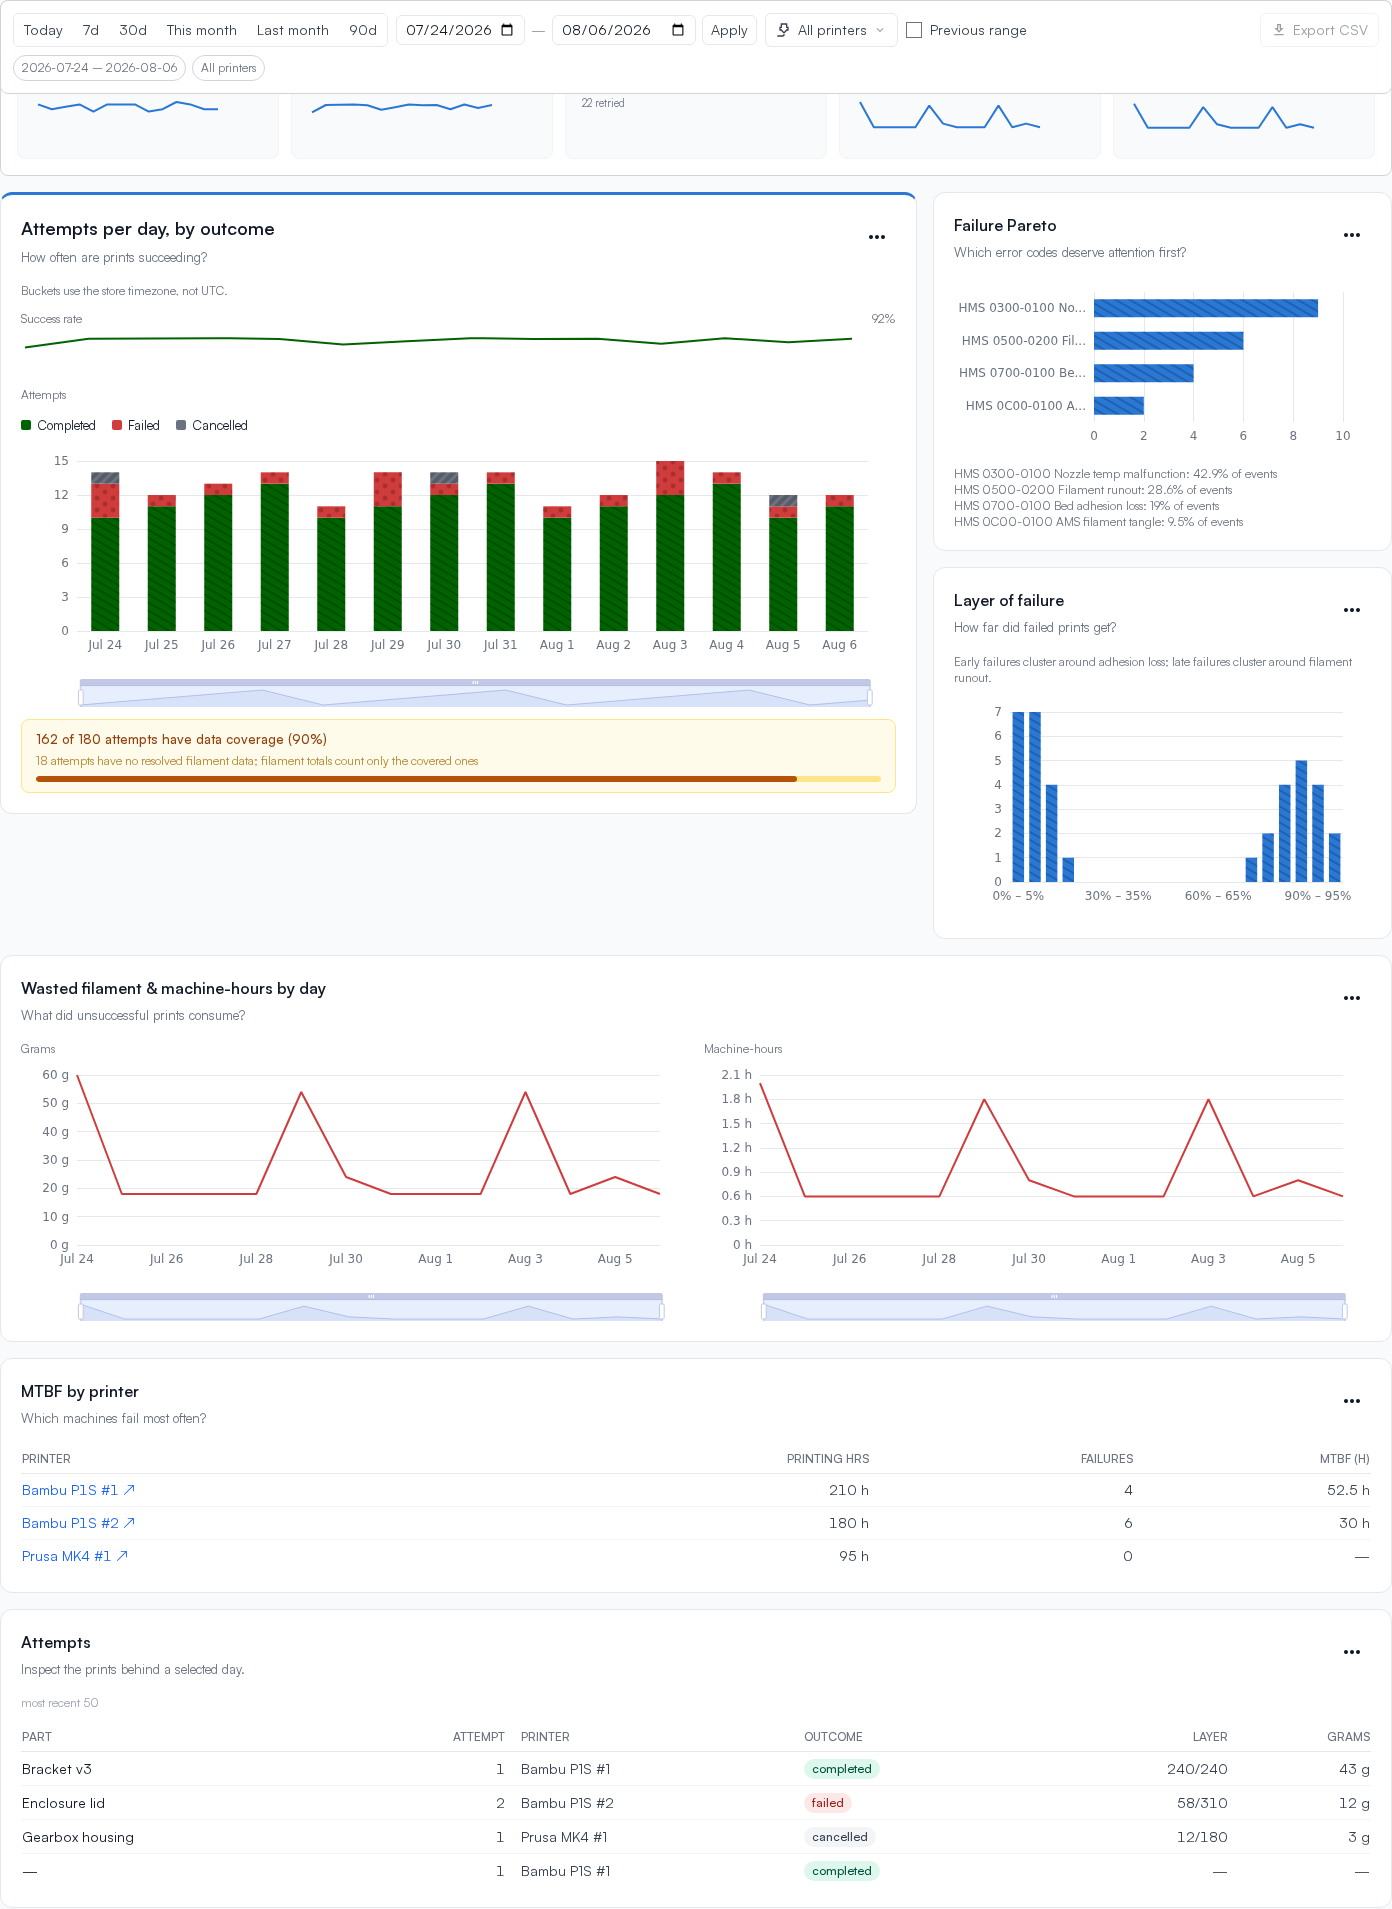
Clicking any day on the main chart opens that day's prints in the table below, so you can go straight from a bad-looking bar to the actual prints behind it.
Jobs & Orders
This report covers flow: queue wait times (how long jobs sit between being queued and starting to print, shown as median and 95th percentile), estimate accuracy (how actual print times and filament use compare to the slicer's estimates), backlog over time, and order cycle time from processing to shipment, including any missed deadlines.
If your queue wait is growing while throughput is flat, you are printer-bound and the backlog chart will show it before your customers do.
Printers
Utilization shows printing hours per machine per day, with long prints correctly spread across the days they actually spanned. The report also tracks the idle gap after each print finishes (how long a machine waits before its next job starts, which is usually an operator question rather than a machine question), a leaderboard of prints, hours, filament, and failure rate per machine, and your maintenance status at a glance.
Materials
Materials shows filament use and spend by day, stacked by material type, plus a By type chart that totals weight for each material type (PLA, PETG and so on) and a By material table with weight, waste, waste ratio and cost for each of your materials, so PLA Basic and PLA Matte get their own rows. Click a row to expand it into its colors, so you can see which colors you actually go through and which ones are costing you in failed prints. Weights are shown in grams below one kilogram and in kilograms above it.
Material charts include a coverage indicator. Filament use is worked out from the sliced file and how far each print got. When Printago cannot work out how much a print used (most often a failed or canceled print where it cannot tell how far it got), that print has no resolved filament data. Jobs canceled before they started printing used no filament and are not counted. When that happens, the report tells you what fraction of prints are covered instead of quietly under-reporting your totals.
Profit
The profit report is a monthly statement rather than a chart page: revenue by sales channel, cost of goods (filament, machine time, and labor based on your cost rates), gross profit, the cost of failed prints, and estimated margin by SKU. Your cost rates are shown next to the results so you always know what the numbers assume.
Two things to know about margins:
- Order revenue is allocated evenly across the items in an order, because sales channels do not always provide per-item prices. Margins are directional, not audit-grade.
- Electricity is not included, since Printago does not know your printers' power draw.
The report labels these assumptions inline wherever they apply.
Usage by user
Usage by user is part of the Filament Inventory add-on, which is in beta testing. For early access, email support@printago.io or ask in our Discord.
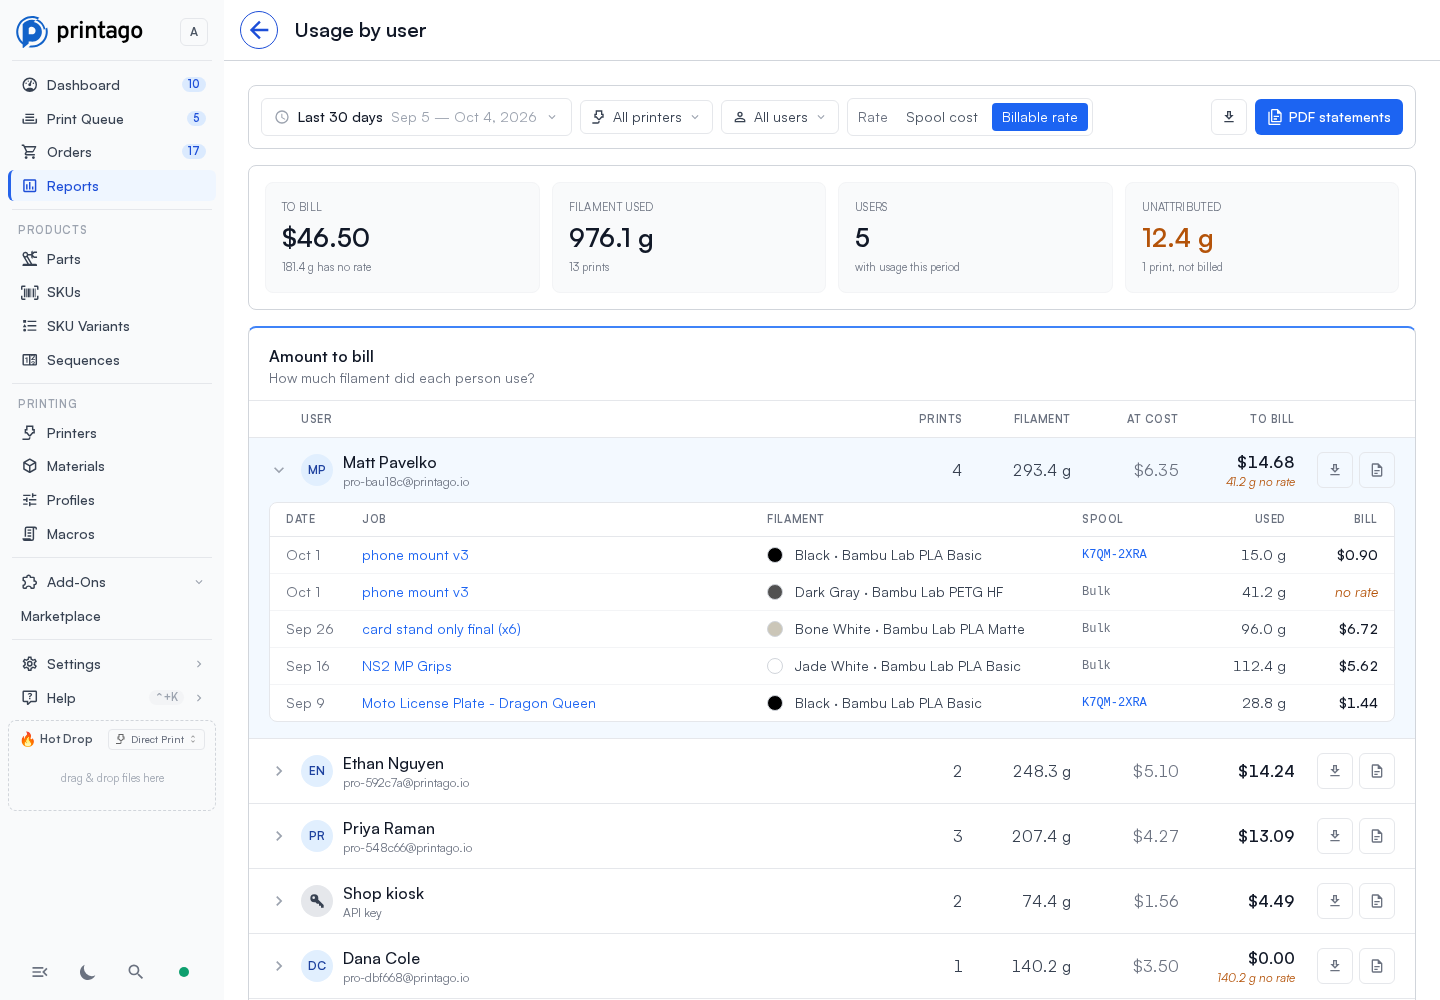
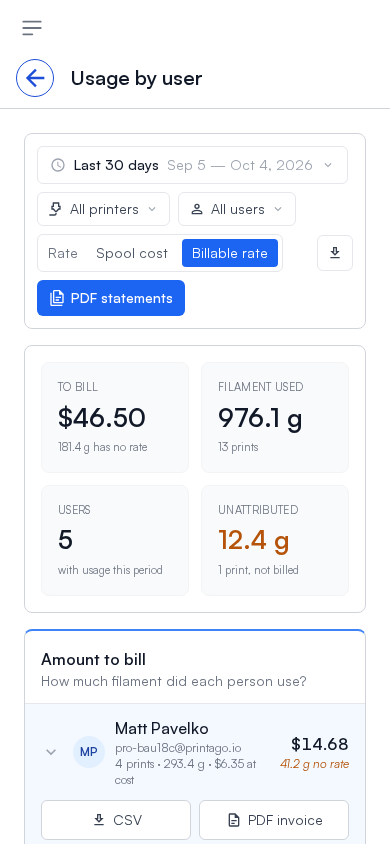
Usage by user shows how much filament each person used over a date range and what to bill them. It is built for schools, makerspaces and shared shops that charge filament back to the people who print. It needs the Filament Inventory add-on, because it reads the filament each print drew from your stock.
What it counts
- Who a print belongs to: whoever queued the job, a person or an API key. An API key gets its own row, like a person.
- Unattributed: prints whose job has no creator recorded, such as jobs queued before Printago recorded who queued them, or jobs that have since been deleted. They are part of Filament used and the total at cost, shown on their own in the Unattributed tile and an Unattributed row above the total, and are never billed to anyone.
- Filament: what each print drew from your stock, from each spool or color it used. A spool is named by its code, or by the end of its ID when it has none, and marked deleted once it is; filament not tracked by spool reads Bulk. A print that drew from two colors shows a line for each. Prints that drew nothing from stock are not counted.
- Dates: a print counts on the day it ended, in your store's timezone.
Pick the dates, printers and people in the filter bar. With people picked, Filament used and the total are theirs alone, and Unattributed is left out. Switch Rate between:
- Spool cost: each print at what its filament cost: the spool's price when it printed, else the color's, else the material's. Repricing or deleting a spool later doesn't change what its past prints cost.
- Billable rate: each print at the material's billable rate in effect when it printed. If you change a rate partway through a month, prints before the change bill at the old rate and prints after at the new one.
A print on filament with no billable rate (or, at spool cost, no price) shows no rate and adds nothing to To bill. It is never billed at cost instead. The person's row shows how many grams had no rate.
To bill is the total of everyone's rows. Each line is rounded to the cent and every total adds up the lines, so the report, the CSV and the statements always agree to the cent.
Exporting and statements
- The download button in the filter bar saves a CSV of every line, with a total for each person, then the unattributed lines, which aren't billed. Its grams add up to Filament used. The download button on a person's row saves just theirs.
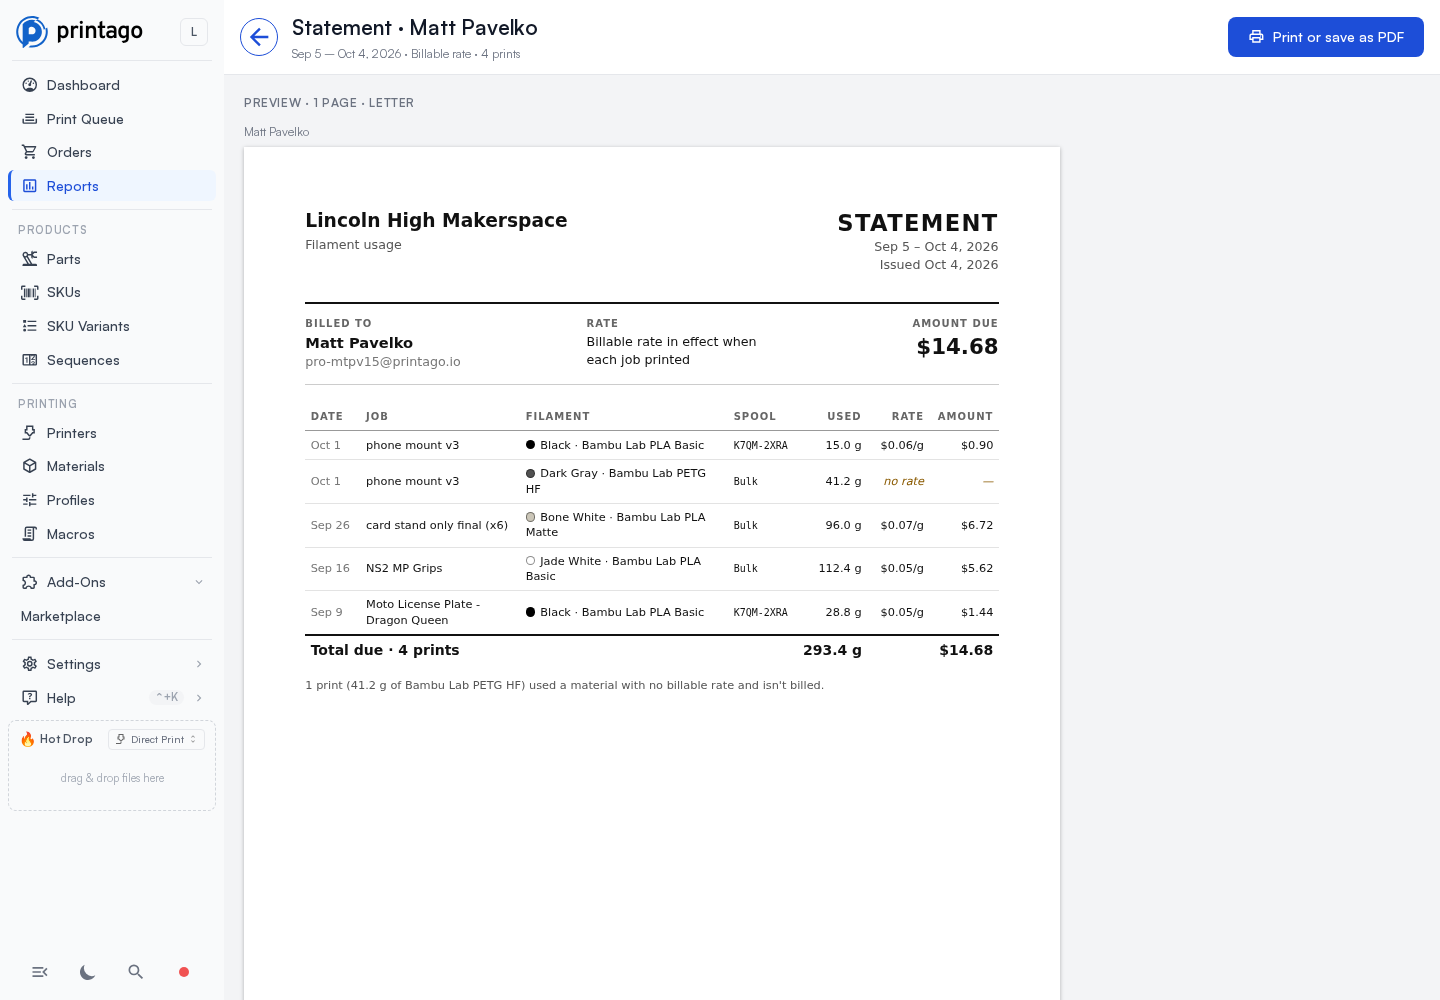
- PDF statements opens a print-ready page: a summary of everyone (with an Unattributed row that isn't billed and a total equal to To bill), then a Letter page for each person or API key ending in Total due. People who owe nothing because none of their prints had a rate are left out of the statements but stay on the summary. A long statement runs onto more pages, numbered.
- The document button on a person's row opens just their statement, which matches their page in the everyone print.
Choose Print or save as PDF and use your browser's print dialog to print or save the PDF. The pages print black on white, even in dark mode.
Exploring and sharing a report
The filter bar stays visible while you scroll. Its date-range control opens a popover with the usual presets (today, 7 days, 30 days, this month, last month, 90 days) alongside a custom start/end date. Search the printer picker to narrow a large fleet, filter by active or needs-attention status, select several printers, or choose All printers; the selection applies when the picker closes.
Turn on Compare to compare with the equally long period immediately before your selected dates. Headline numbers show the change, and time charts show dashed comparison lines. Missing comparisons say No previous data; a zero baseline is not displayed as an infinite percentage. Daily points are aligned by their position in the two ranges. P&L uses Previous month and always covers a calendar month across all printers.
Hover over a chart to read values along its crosshair. Select legend labels to hide or show series. You can also enter exact dates in the filter bar. Use your browser's Back button to undo a range change.
Every chart and table has a ••• menu:
- Expand opens the report in a large dialog. Press Escape or use the close button to return.
- View data shows the underlying rows. Select a column heading to sort ascending or descending. On a phone, scroll inside the table to see more columns.
- Download CSV saves that card's rows. Download PNG and Download SVG save a picture for sharing.
- Copy link includes the dates, printer selection, comparison setting and target card. The recipient sees the same filtered report after signing in to their own authorized store.
- How this is calculated explains the inputs and limitations. Coverage and sample-size notes also appear inside the relevant card.
Printer names, spool names and SKU labels link to their detail pages when the underlying entity still exists. Material-type aggregates do not identify a single material, and failure-event counts do not identify individual prints.
The page-level Export CSV button continues to export that page's primary dataset. Use each card's download action for secondary datasets. P&L's selected month is included in its URL.
Permissions
Reports is visible to any member whose role includes the analytics.view permission. Admins, operators, and viewers all have it by default. Usage by user also needs the Filament Inventory add-on on the store.
Calculation reference
How often are prints succeeding?
Completed, failed and cancelled prints grouped by end date in the store timezone. Success rate is completed prints divided by all prints.
A cancelled print is included in the denominator. The small trend needs at least seven data points.
Which error codes deserve attention first?
Counts of health-error and print-error events, ranked by code.
Events are not failed prints: one print can emit multiple codes. The ten highest counts are shown.
How far did failed prints get?
Failed prints grouped into five-percentage-point buckets of completed layers divided by total layers.
Prints without layer data cannot contribute to this distribution.
What did unsuccessful prints consume?
Weight and printing hours on failed or cancelled prints, grouped by day.
Filament totals include only prints with resolved usage. Weight and hours use separate axes.
Which machines fail most often?
Printing hours divided by failure count for each physical printer.
No failures means no finite MTBF, shown as a dash.
Inspect the prints behind a selected day.
The most recent 50 prints matching the date range, printer scope and selected day.
This is a bounded detail list, not the full print count. Export contains the displayed rows.
How long are jobs waiting to start?
Median (P50) and 95th percentile (P95) minutes from queuedAt to printingStartedAt for prints started that day.
Only prints with queue timestamps are included. P95 highlights long waits.
Are slicer estimates close to reality?
Median actual-to-estimated time and weight ratios by day. A ratio of 1 means the estimate was exact.
Missing or unusable estimates are excluded. The reference series is always 1.
Is the queue building up?
Jobs queued but not yet printing at the end of each day in the store timezone.
Historical counts reflect recorded queue and start timestamps.
How long do orders take to ship?
Hours from order processing to shipment, grouped by shipment day; the chart shows the median.
Only shipped orders have a completed cycle. Deadline misses count shipped orders past their deadline.
Which printers are doing the work?
Printing hours overlapping the selected calendar days, divided by the range day count for each physical printer.
A printing interval is spread over the days it overlaps. This is printing time, not an online/idle telemetry measure.
How much production time is the fleet delivering?
Sum of printer printing hours for each calendar day.
A fleet can exceed 24 printing hours in a day because multiple printers work concurrently.
Where does time pass between jobs?
Median and P95 minutes from job-finished to the next printing-assigned-job event on each machine.
Requires adjacent recorded job events. It does not measure offline time.
Compare output and failures across machines.
Per-printer print counts, completed and failed counts, usage, printing hours and failure rate.
Missing material measurements are excluded from weight. Failure rate uses recorded prints.
Which machines need attention?
Current maintenance enrollment and due/overdue counts.
These are current status values, not historical snapshots for the selected dates.
What filament is the farm consuming?
Resolved filament weight grouped by day and material type. The API folds its tail of types into Other.
Prints without resolved material usage are excluded; review coverage below the chart.
Which material types does the farm go through most?
Resolved filament weight in the selected range, totaled by material type.
Prints without resolved material usage are excluded. Every type is shown, including those the daily chart folds into Other.
How much is recorded filament usage costing?
Sum of recorded material usage costs by day.
Missing prices are excluded, not treated as free material. This may be a partial cost total.
Which materials produce the most waste?
Usage and failed/cancelled-print waste for each material, with each row expanding into its colors; waste ratio is wasted weight divided by weight.
Usage recorded without a color is listed as "No color recorded". Costs require available prices.
What did this month earn after production costs?
Revenue by sales source, less filament, machine time and labor costs; gross profit is revenue minus total COGS.
Calendar month in the store timezone, across all printers. Current rates apply; missing prices are excluded and electricity is not modeled.
What did failed prints cost?
Recorded wasted weight and machine hours valued using configured cost rates.
Estimates use current rates, with no electricity model. Missing rates can leave the cost unknown.
Which products leave room for profit?
Estimated gross margin is revenue minus estimated cost, divided by revenue, for each SKU.
Order revenue is allocated evenly across items. Margins are directional; the ten highest available margins are shown.
How many prints finish each day?
Finished prints in the selected range divided by its calendar-day count. The daily trend shows finished print counts.
This headline includes completed, failed and cancelled prints; it is not a count of unique jobs.
How often does a job finish on its first print?
Jobs finished on their first print divided by all finished jobs in the selected range.
Retries count separately from the finished job. No finished jobs means the yield is unknown.